Save Hours vs Manual Reports
Spend more time analyzing, less time manually creating reports
Improved Report Accuracy
Eliminate the potential for human error in manual data entry
Streamlined Decision-Making
Faster data access empowers teams to be more proactive than reactive
NQS Standalone Dashboard
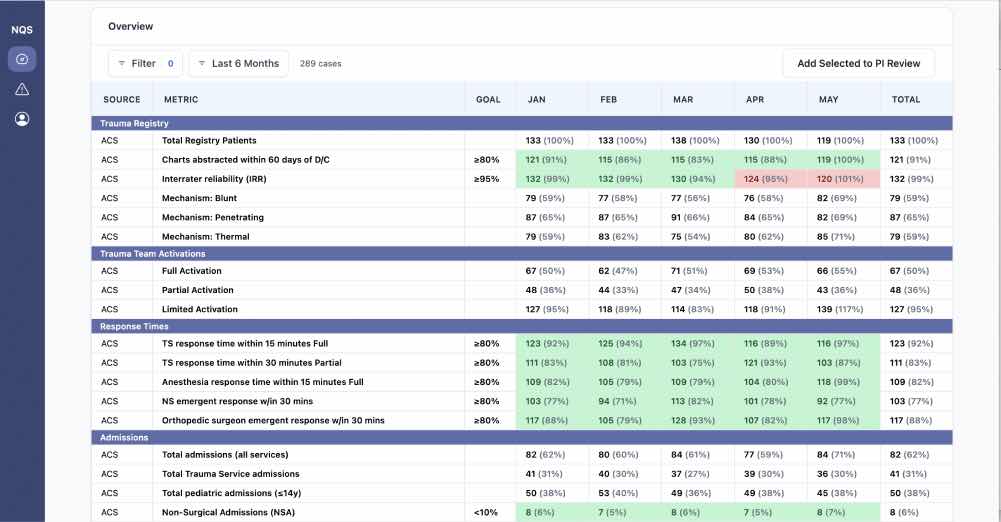
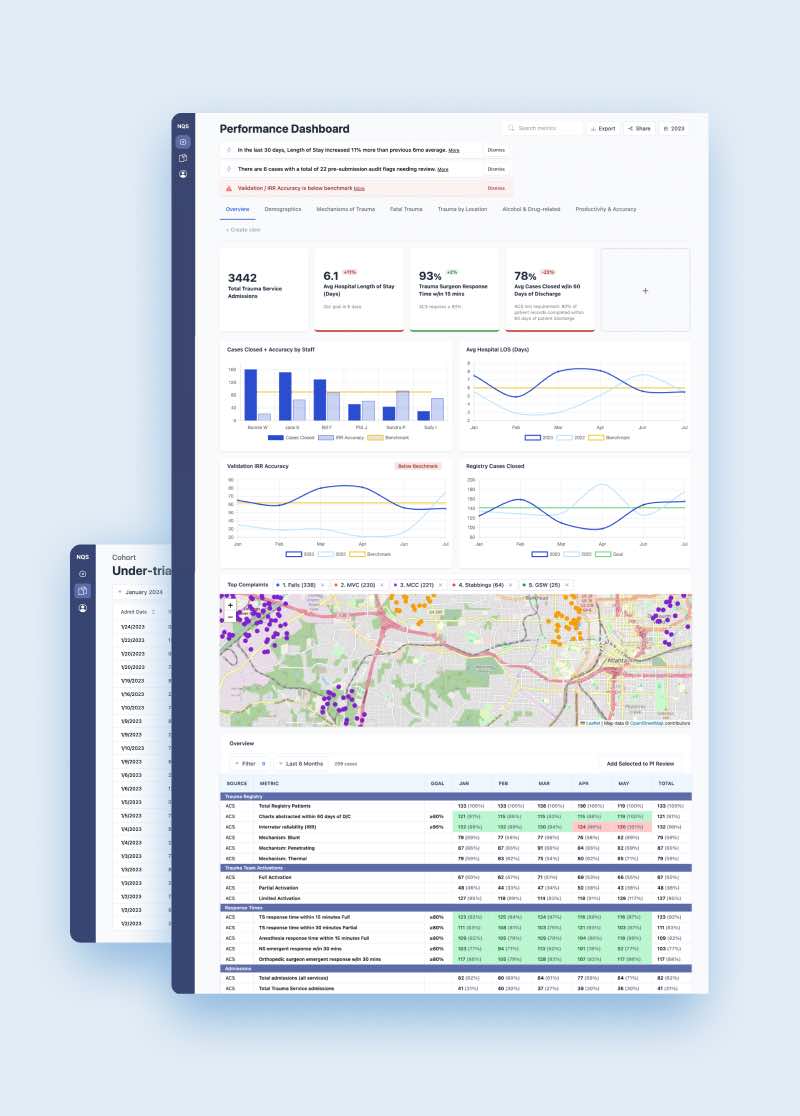
Import From Your Registry, View Instantly
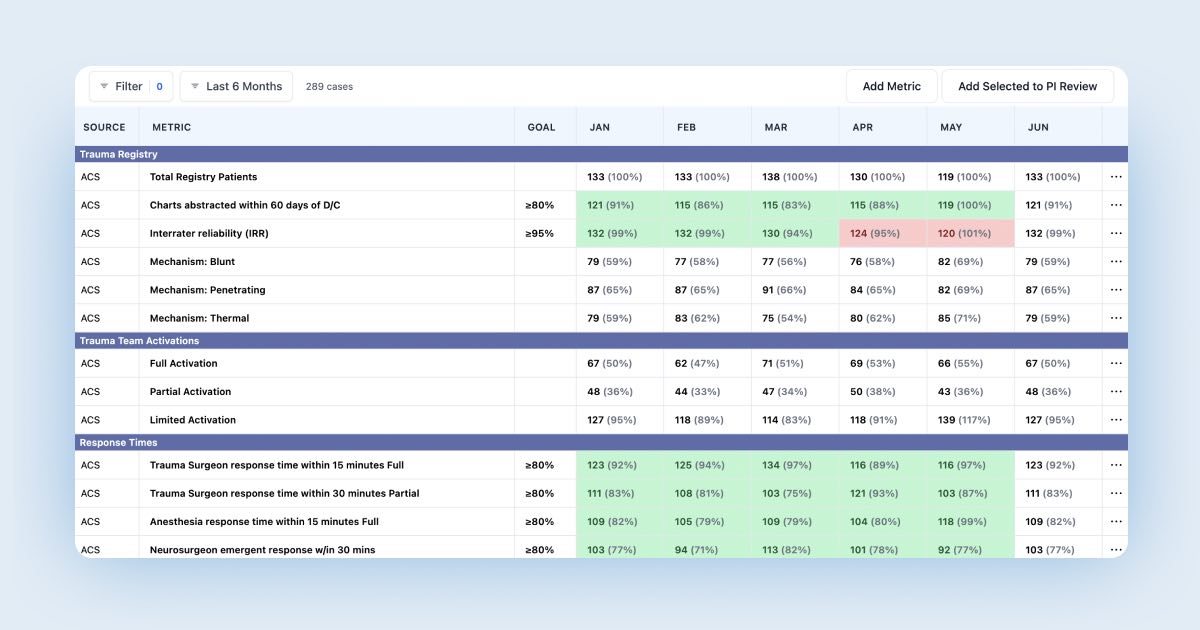
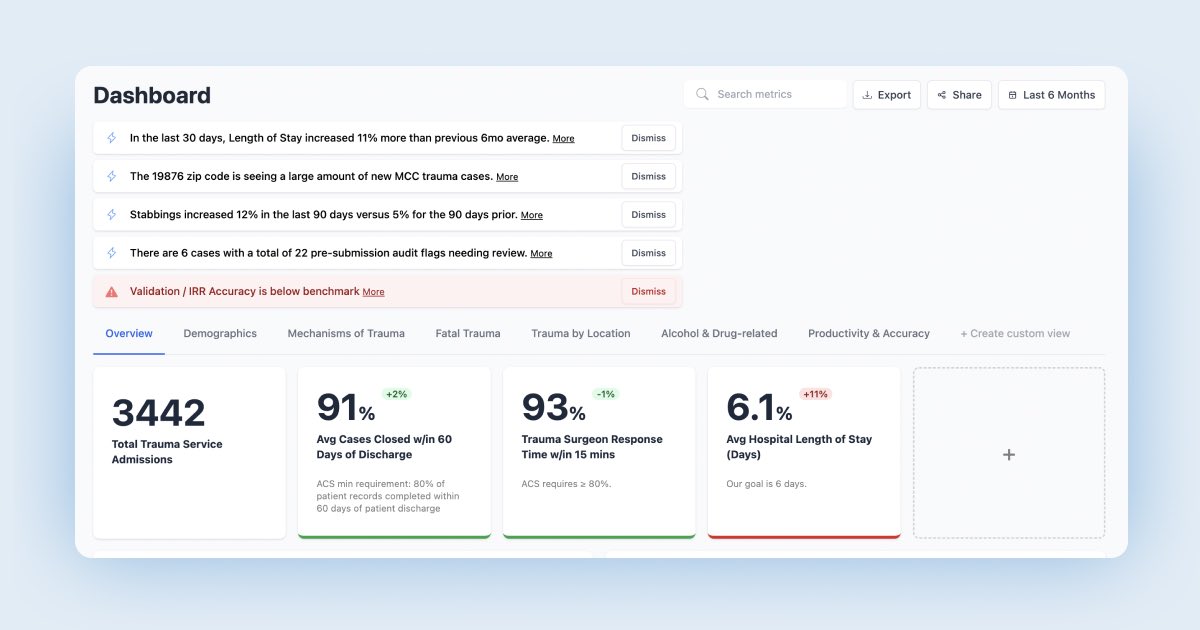
Import your registry data daily, weekly or monthly and view instantly. See at a glance dozens of standard metrics, viewable as trends throughout the year.
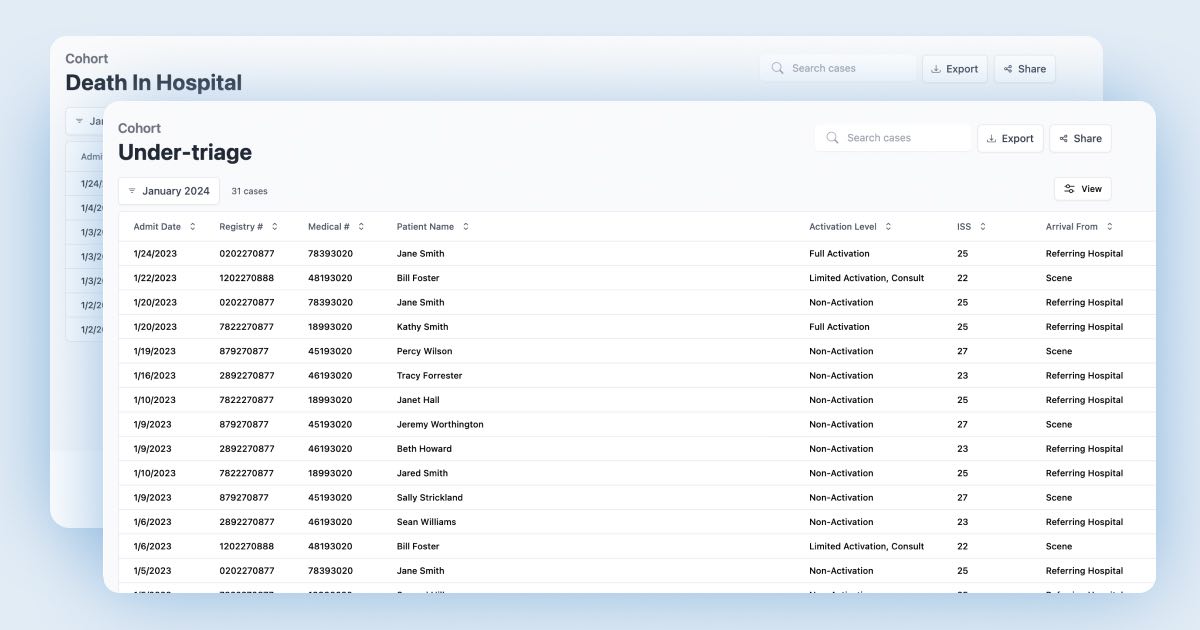
One-click Drill-down Reports
A significantly simpler way to generate standard reports that saves hours. One click on the metric value from the table above displays the drill-down cohort report instantly.
Outlier Measurements Highlighted
The NQS Standalone Dashboard automatically calls attention to measurements that deserve your attention. Based on your performance versus benchmarks.
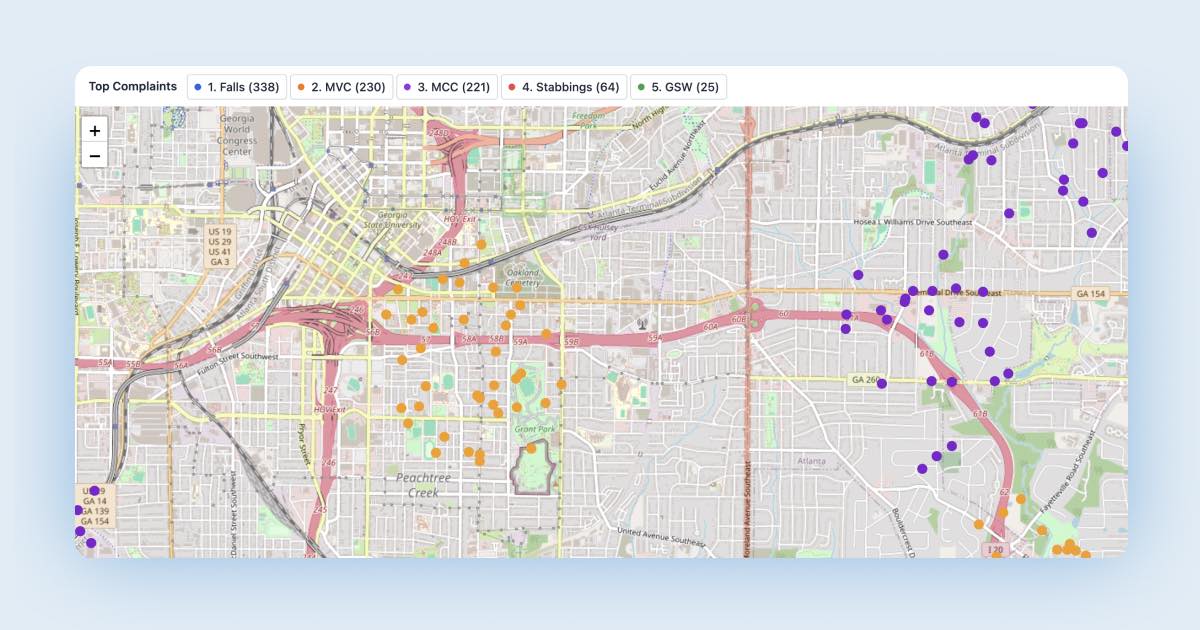
See Where Top Mechanisms of Injury Happen
Enhance injury prevention efforts and planning by viewing top complaints by location. Down to the intersection.
What Trauma Centers Are Saying
“I’m a very visual person. I think this is great. This is just so much more incredible than what we have currently.”
“Seeing a large amount of MCC trauma cases… it’s vital seeing those trauma cases in that zip code. It allows them to target injury prevention into that area.”
“This is incredible. It’s putting pathways in front of you to start to go down operational inefficiencies.”
“So much of my time was wasted… felt like it was never ending of running reports. I’m amazed that this gives you ideas of where to focus your energy. Especially as a newer trauma program manager. It’s great to then… sound impressive going to the trauma surgeon.”

