![]()
Time matters in trauma care— in treating patients, of course.
But time is also a factor in managing the data that informs those treatments. Time spent manually building performance dashboards and reports is time NOT spent uncovering insights and implementing care improvements.
The status quo is time-consuming, tedious, and prone to human error, creating bottlenecks that can slow patient care improvement efforts.
Challenges
We see many trauma teams run into these dashboard and reporting challenges:
🚧 1. Registry software that is not easy to use
Antiquated software that doesn’t make data management and reporting easy.
🚧 2. Not seeing what’s possible
Not having a complete grasp of all the data available and which levers of improvement to focus on (partially due to 1 above).
🚧 3. Specific Excel skills needed
Not comfortable using Excel to create pivot tables, conditional formatting and other data management
🚧 4. Issues handling incomplete data
Not properly handling instances of missing or incomplete data that affect measurements.
🚧 5. Tedious and time-consuming
Spending more time wrangling data than acting on the data. Not fun.
🚧 6. Errors
Any tedious and time-consuming manual process opens any team up to human error.
But imagine if trauma teams could bypass the painstaking “data wrangling” step of manually building performance dashboards and reports, allowing them to devote more time to observing patterns, discovering root causes and implementing change.
Thankfully, this is possible with modern clinical intelligence software. Let’s see how.
But first…
Why Trauma Dashboards Matter
Thanks to all the trauma team professionals out there putting in all that effort and overcome all of those issues mentioned above to build out their performance dashboards and reports. Daily. Weekly. Monthly. Here’s a friendly reminder why all that effort is so important:
It’s how our trauma programs…
- Improve policies and guidelines
- Refine processes
- Adjust staffing to what is needed
- Plan education in the community
- Conduct research that affects change
Which all lead to improving patient care. You can see why doing it, and doing it well, matters.
But there has to be a better way, yes?
The Old Way Needs to Change
The way we build trauma performance dashboards and reports has remained antiquated for too long. This is how it works for many of us:
- Someone on the team exports giant datasets from the trauma registry.
- They then meticulously manipulate that raw data within Excel to build pivot tables, calculate stats, create graphs, and flag outliers.
- They then configure the layout and formatting to turn it into a usable dashboard.
This can take hours of repetitive manual work stitching together disparate spreadsheets. And hours of manual work, by nature, opens up teams to errors.
And all that’s before anyone can even analyze or act on the data!
Reactive, Not Proactive
The result? Spending more time on “gathering the data” than on “acting on the data” can lead to being more reactive than proactive.
We’ve felt the pain firsthand.
This is why we published a trauma performance dashboard Excel template and video as well as a cheatsheet for how to tally 85 common trauma measurements as a small step toward helping speed up this old process. If just a little bit.
But we all want to improve things significantly. Not just a little bit.
Surely, there must be a more modern way to handle this, yes?
Modern Trauma Clinical Intelligence
The management of complex data has come a long way.
The advancements of tooling, processes and services for managing data, insights and reporting developed for industries outside of healthcare, as well as within it, has been remarkable. Clinical intelligence has benefited alongside this broader data intelligence ecosystem growth.
- Technological Innovations
- Data Interoperability Standards
- Privacy and Security Enhancements
- Collaboration Enhancements
There’s never been a better time for software to enhance the working lives of those involved in improving patient care.
So, how should this apply to trauma performance data management specifically? What is the better way to get more accurate trauma clinical intelligence into the hands of trauma teams faster?
What we believe:
A Simpler, Faster Process
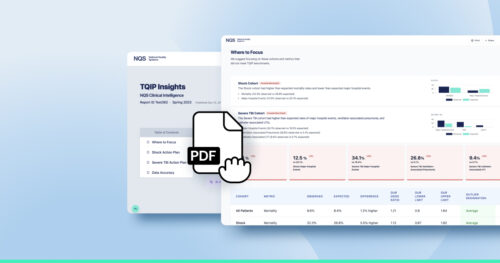
Import data from your existing registry daily, weekly or monthly into a standalone dashboard. Instantly view your updated performance dashboard and reports.
No Excel acrobatics needed. No tallying dozens and dozens of metrics. No complicated report writing to view standard drill-down reports.
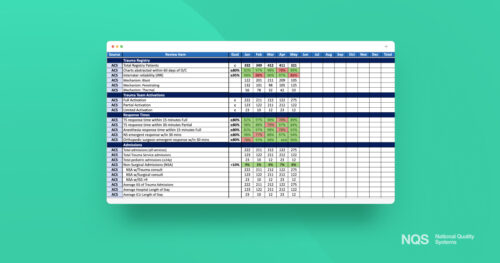
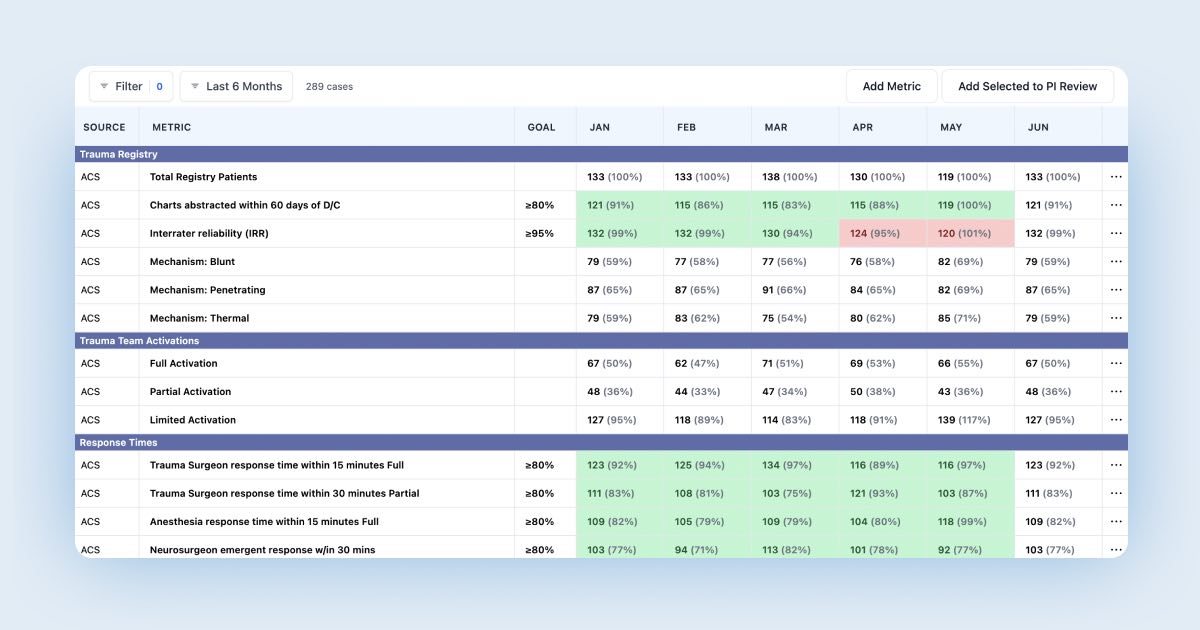
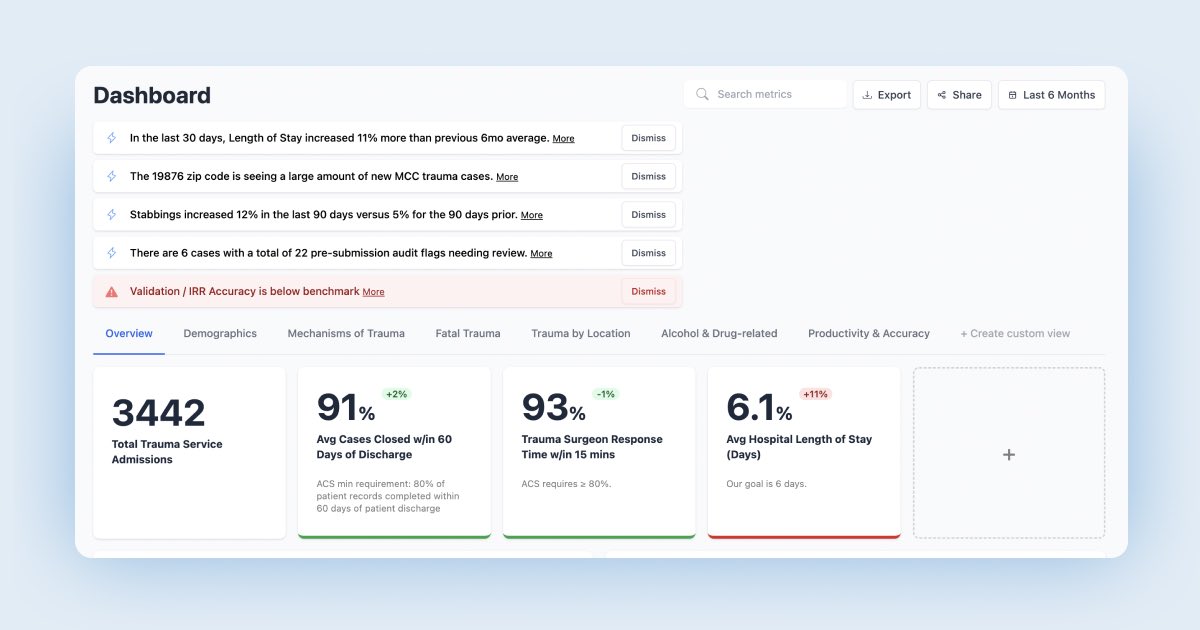
Instant Trauma Performance Dashboard
Trauma teams should see at a glance dozens of standard metrics, viewable as trends throughout the year. See the metrics as well as benchmarks and goals at a glance. Results are meeting your goals? See green. Missing goals? See red. No need to set up conditional formatting. It just works.
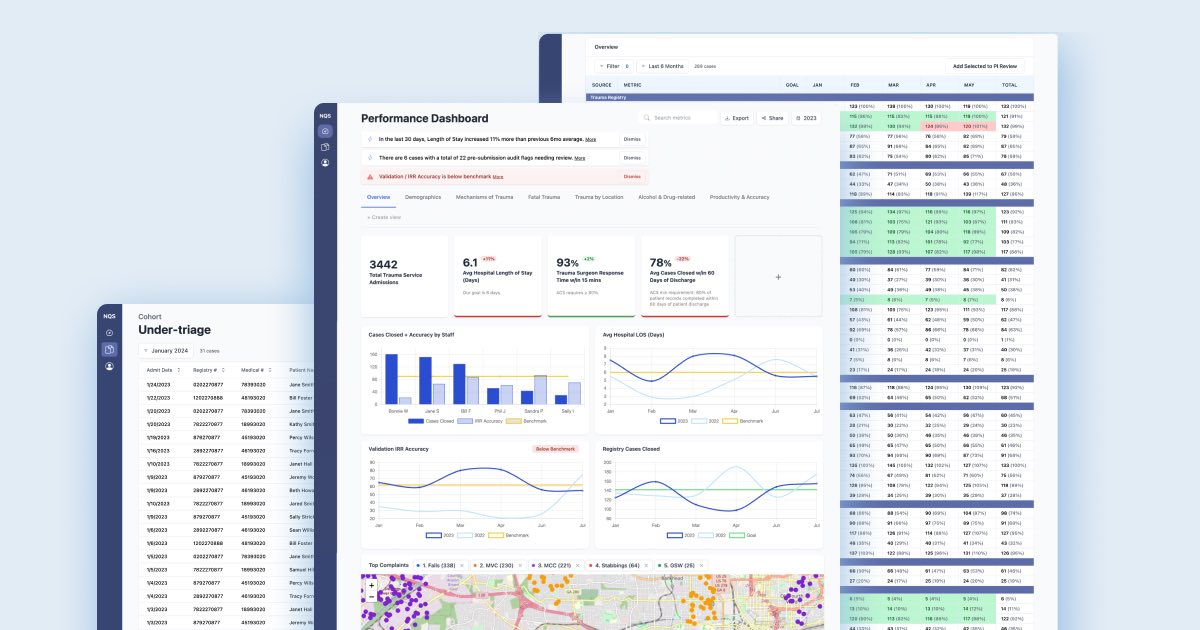
One-click Drill-down Reports
Trauma teams should have a significantly simpler way to generate standard reports that saves hours. One click on the metric value from the table above displays the drill-down cohort report instantly.
For example, click the value for this month’s Under-Triage cases: “31.” And get an instant drill-down cohort report for those 31 cases.
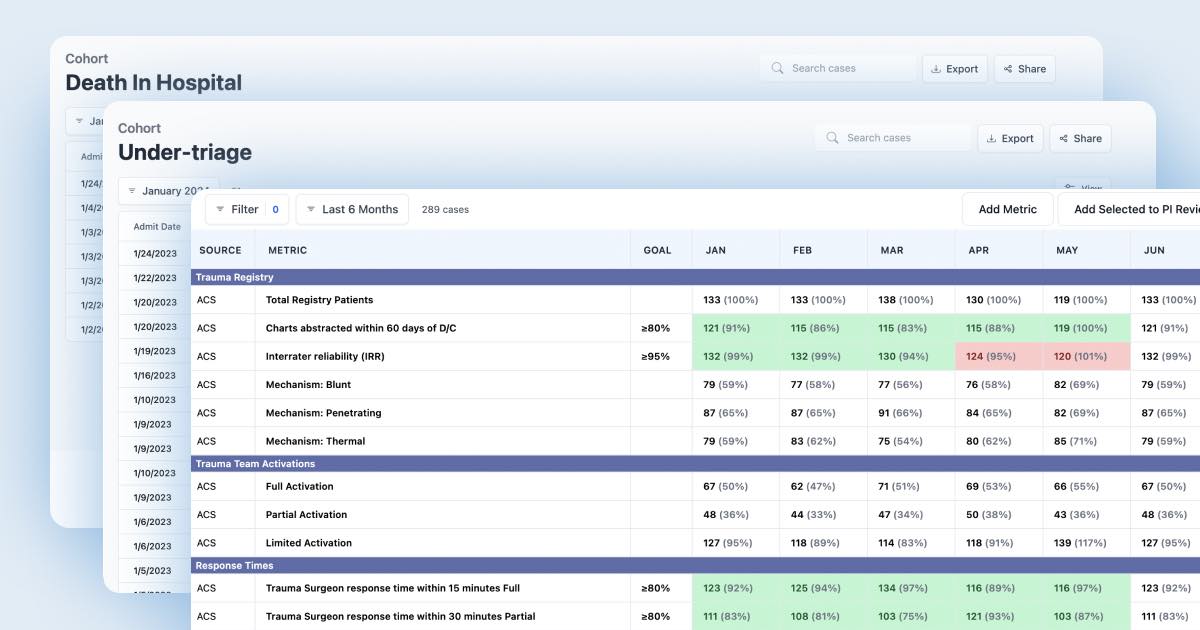
See Outliers Highlighted
Trauma teams should be able to very clearly see measurements that deserve their attention. These outliers are based on actual performance versus benchmarks and goals.
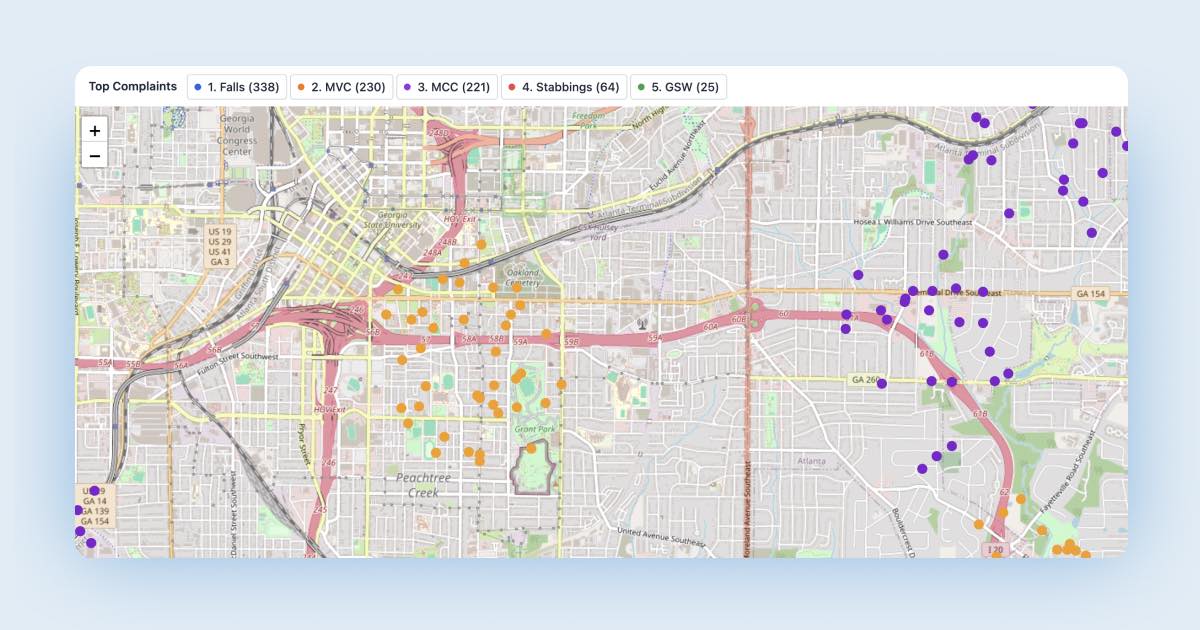
See Where Top Mechanisms of Injury Happen
Trauma teams and their injury prevention teams should be able to see at a glance where clusters of injuries are taking place. Enhance injury prevention efforts and planning by viewing top complaints by location on an interactive map. Scroll around your community. Zoom in and out.
Like a Google Maps for your mechanisms of injury.
And all of the presentations of insights above are great. But where it really matters: sharing those insights with your team. It should be easier to share insights with the broader trauma team.
Try It For Yourself
Modern clinical intelligence software can significantly streamline data management for trauma teams, saving time and improving access to insights. By providing fast access to critical data, it can enable quicker, more informed decisions.
We’re excited to introduce the NQS Standalone Dashboard as a step forward in this field. Join us for a demonstration. We look forward to continuing to collaborate with the trauma community towards better tools for trauma care providers.